Observability
Integrating Fennel With Grafana
You can easily plot metrics exposed by Fennel on your own Grafana dashboards by adding it as a Metric Data Source in Grafana. Here is how to do it:
Setting up Grafana
- Choose a name for the data source (e.g.
Fennel Prod).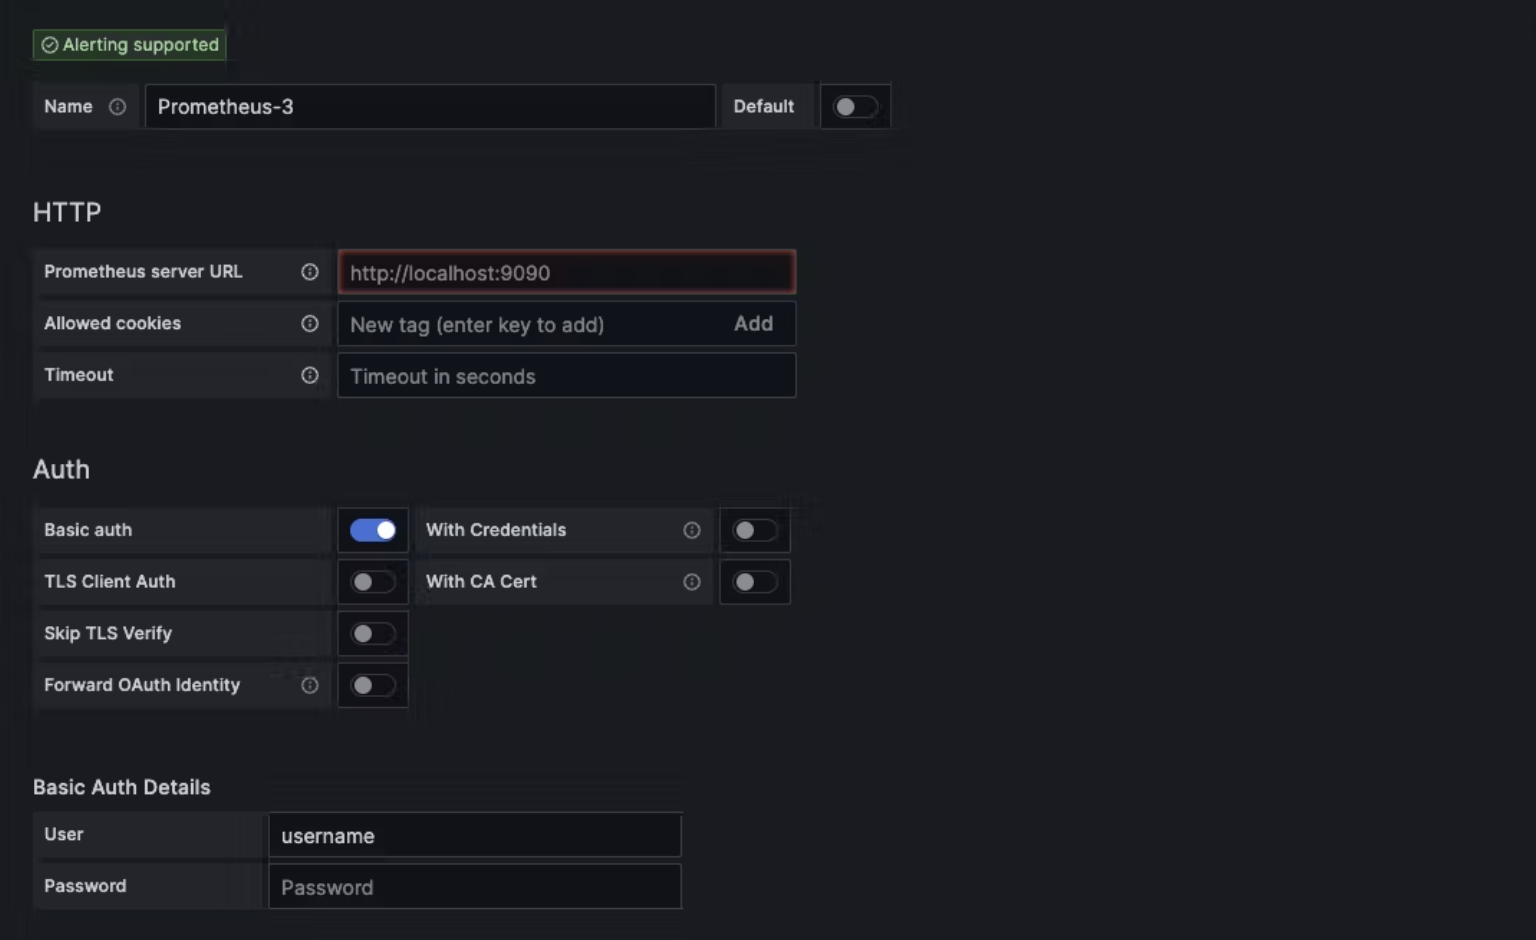
- Add the Prometheus Server URL as
https://<your-cluster-url>.fennel.ai/prometheus/ - Enable
Basic Auth, set User asusername. Contact Fennel support to get the password. - Save the data source
Dashboard Template
You can use the following Grafana Dashboard configuration for an out-of-the-box setup (and modify them subsequently as required).
- Create a dashboard by using
Importoption underNewbutton
- Paste this JSON file
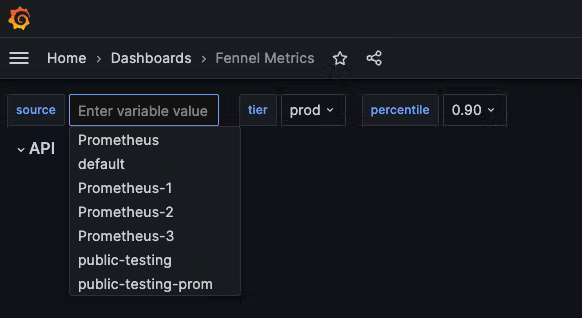
- Select the Prometheus data source name as selected above in the integration