Development Workflow
Fennel Console
Fennel ships with a web console where you can see definitions and status of all your datasets and featuresets and is a helpful tool for diagnostic & introspection workflows.
Here are some examples of things that can be done via the Console:
Feature Catalog
Fennel console has a searchable catalog of all the datasets & featuresets. There is a dedicated page for each dataset, featureset, extractor, and feature where you can see their definitions, metadata, and a lot of other diagnostic information.
Reading Definitions
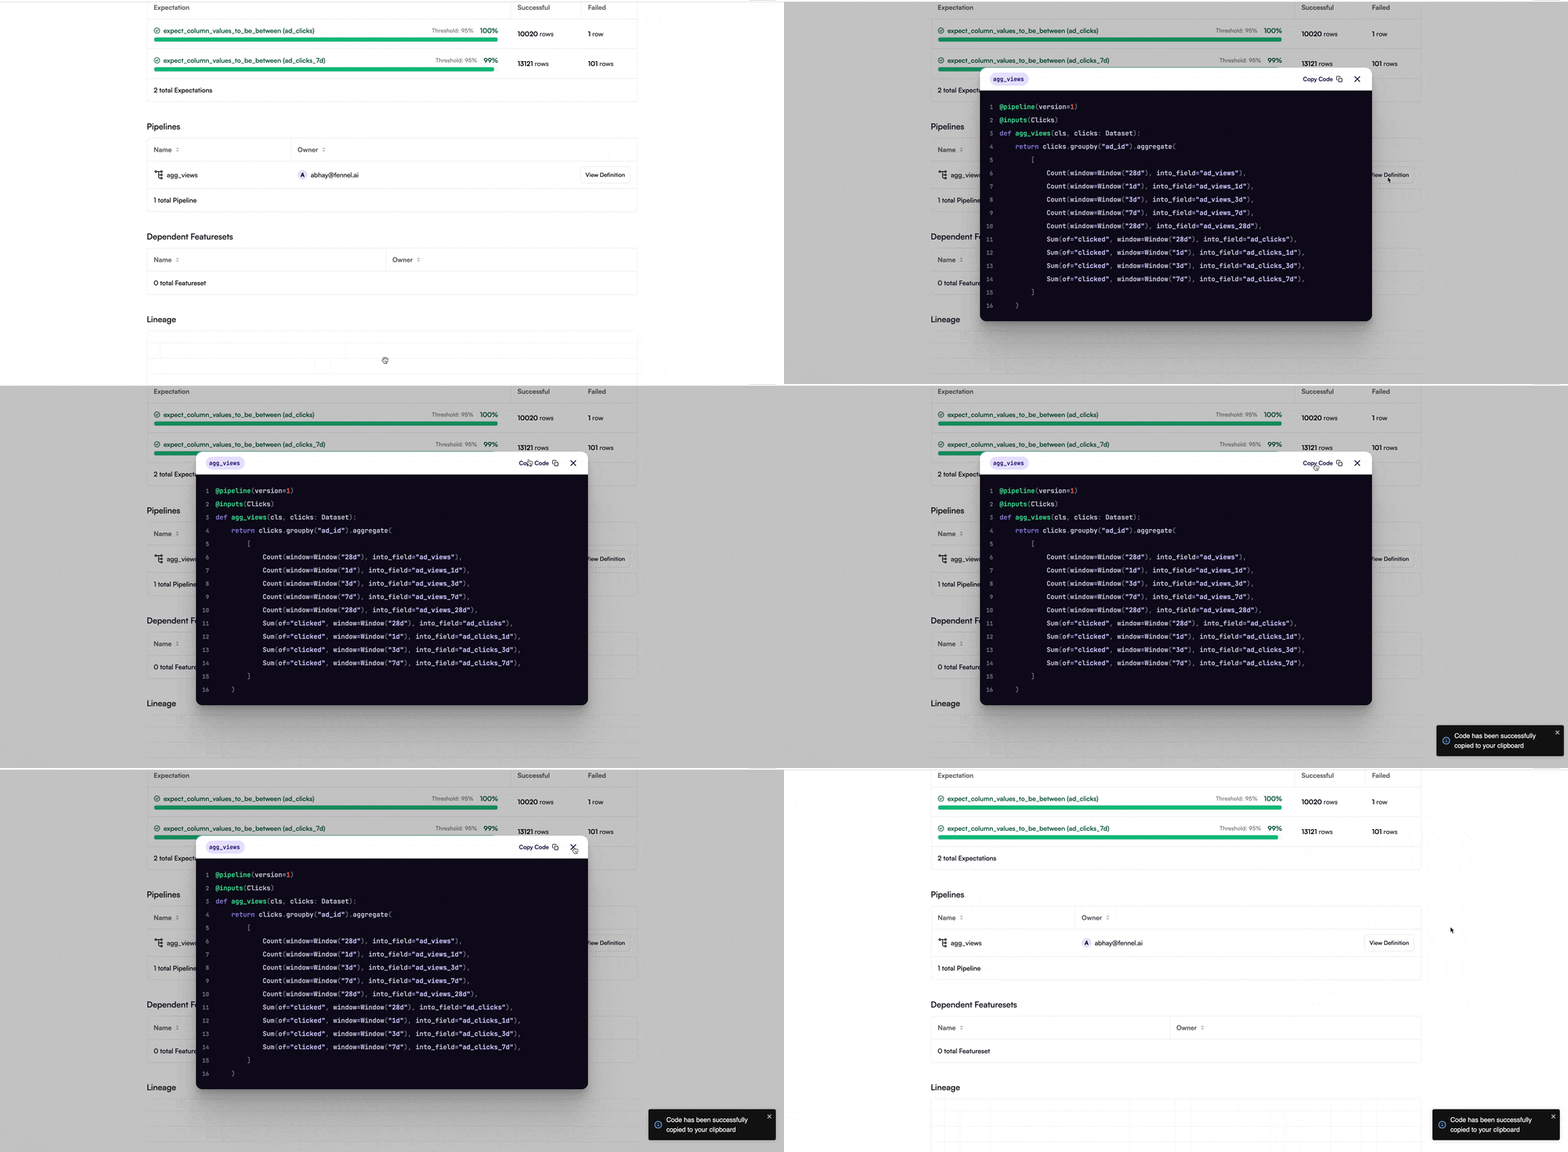
You can read the Python code definitions of all pipelines & extractors in the console.

Write Side Errors
Thanks to strong focus on data quality and correctness, Fennel is able to catch and prevent a lot of errors at the compile time itself. That said, sometimes runtime errors can also happen, especially on write side - a) during data ingestion from external sources and b) in pipelines as data is being transformed.
Fennel console exposes all write side errors for you to see and fix. (Note: the number & rate of of errors is exposed as metric behind Prometheus endpoint too in case you want to do automated alerting on it. See observability for details.

Pipeline Lag
A newly written pipeline needs to process all older data before it can "catch up". One common workflow is to write/sync a new pipeline and wait for it to catch up before starting to use it in production or A/B test.
The page of a dataset in the console shows its backlog, the timestamp of the last processed row, and the number of rows processed per second. As the pipeline catches up, the backlog should go down (but probably not zero because it is continuously processing new live data too), the timestamp of the last processed row should become more or less same as the current time and the number of rows processed per second should drop significantly to whatever is the rate of new input rows.

Viewing Lineages
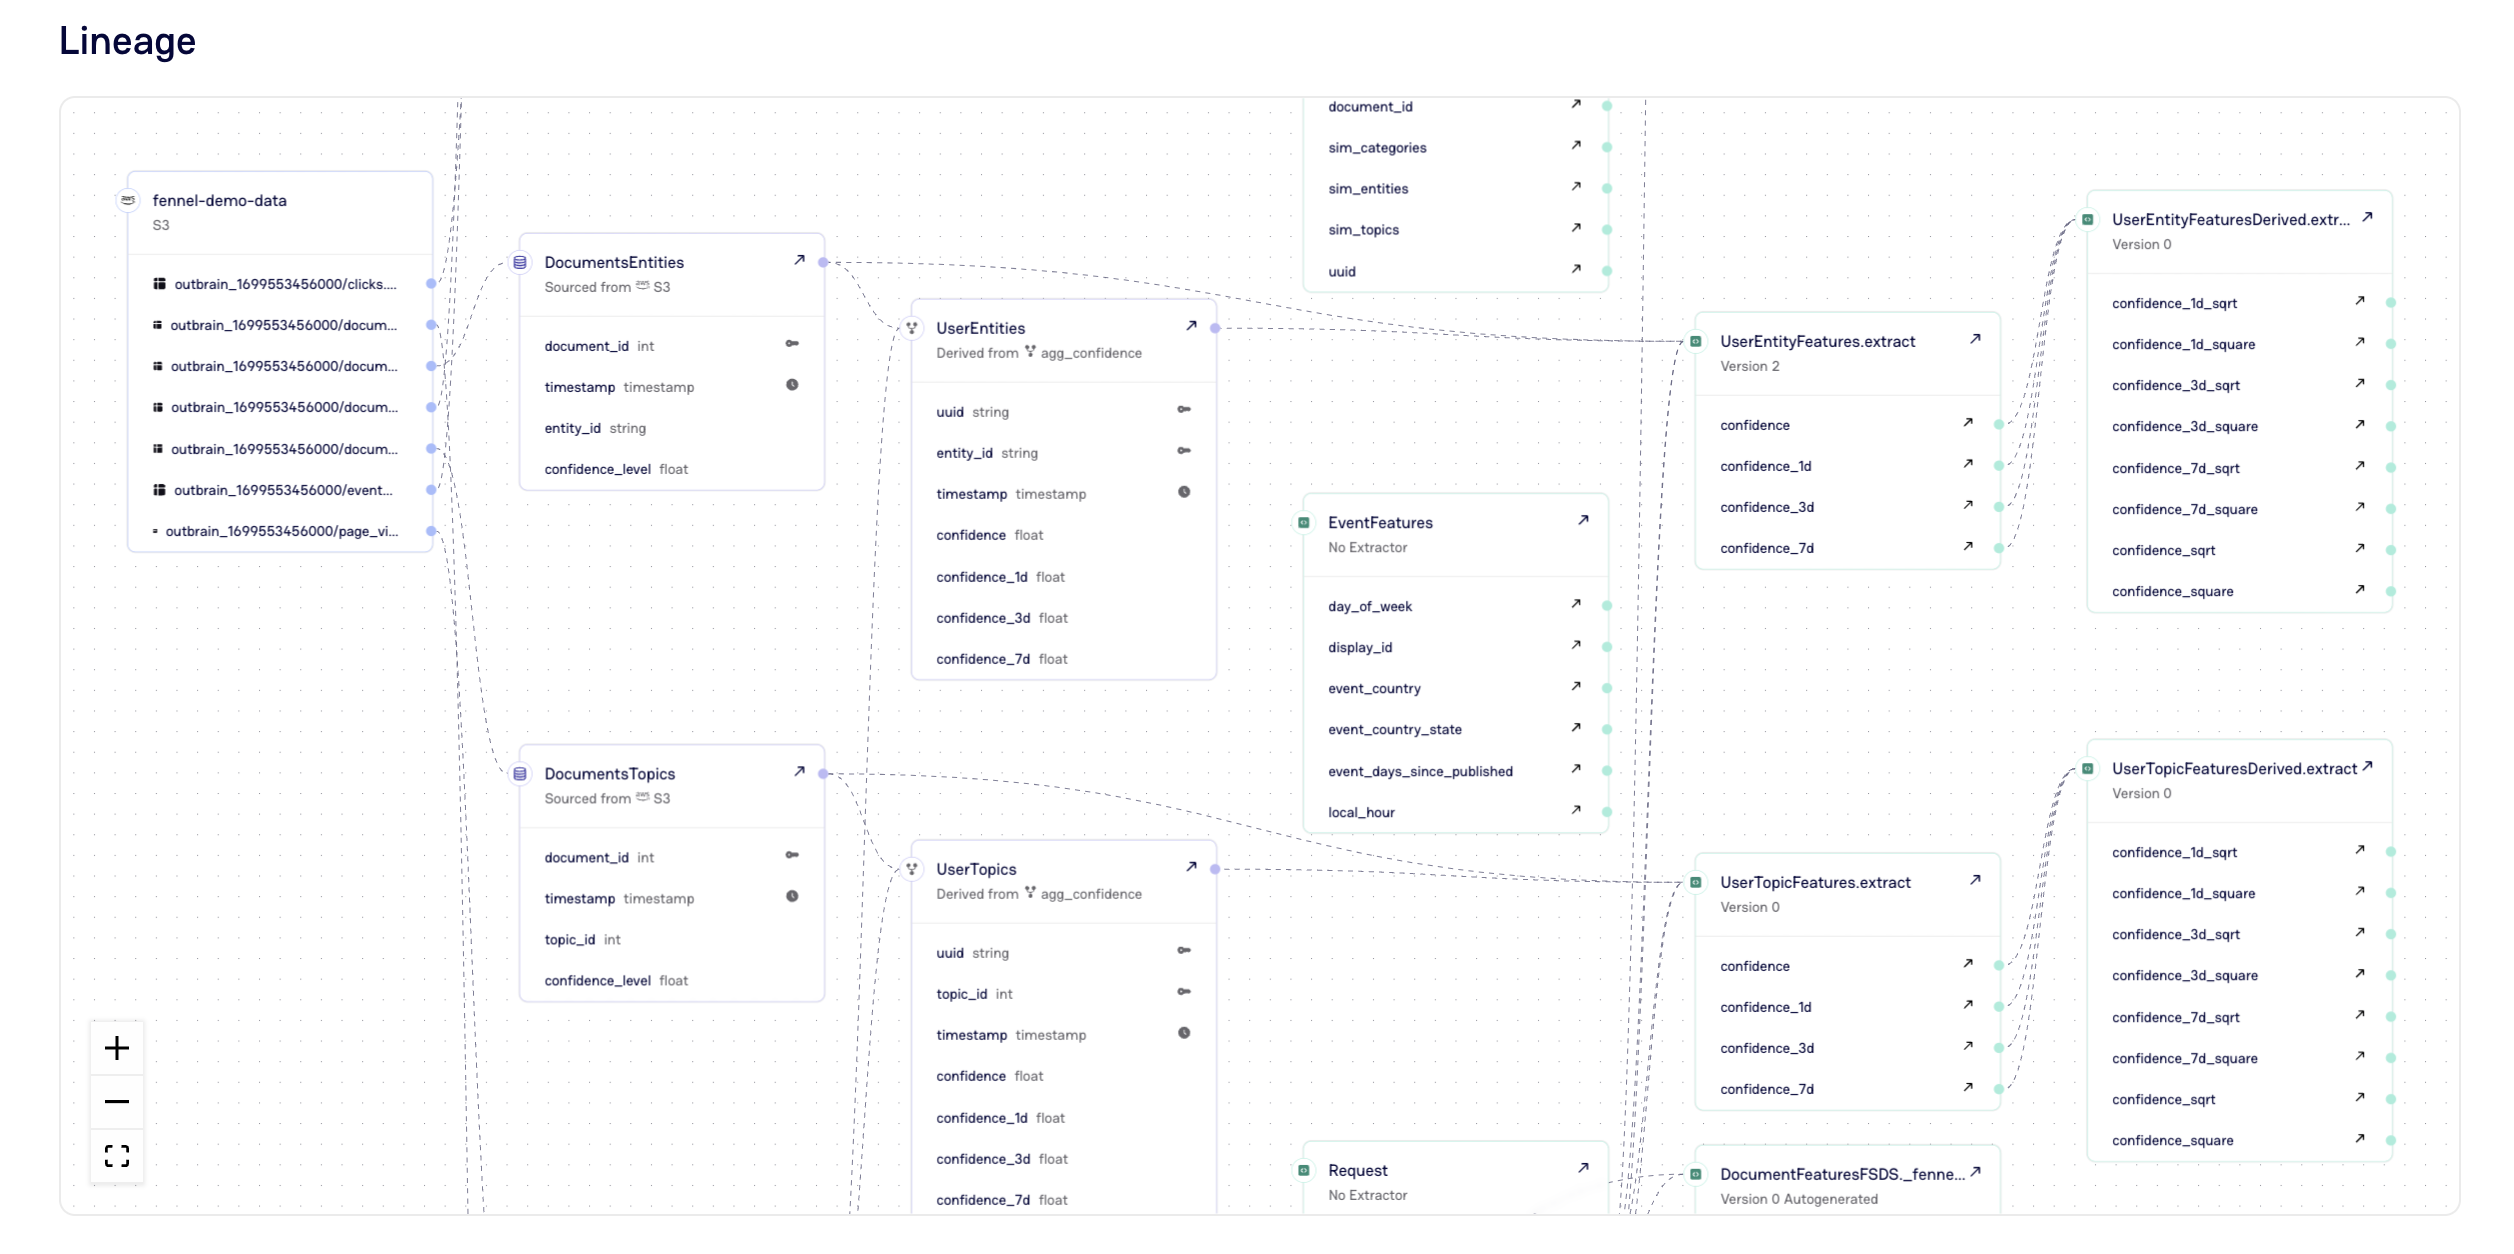
Fennel automatically infers and tracks end to end lineage of the entire dataflow
DAG. These lineage diagrams can be viewed in the console.
