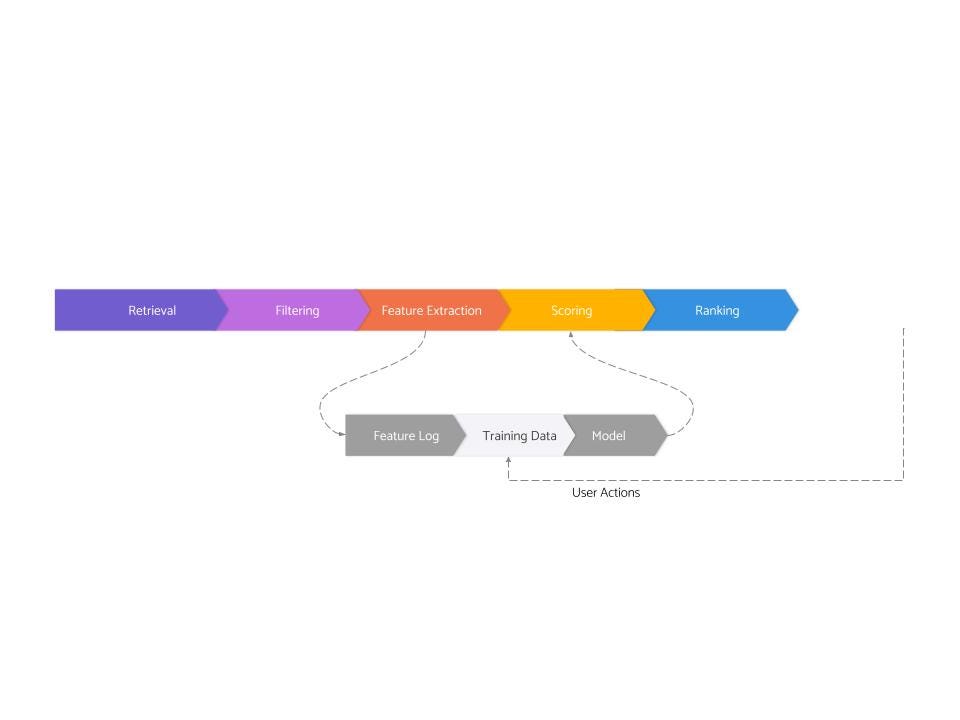
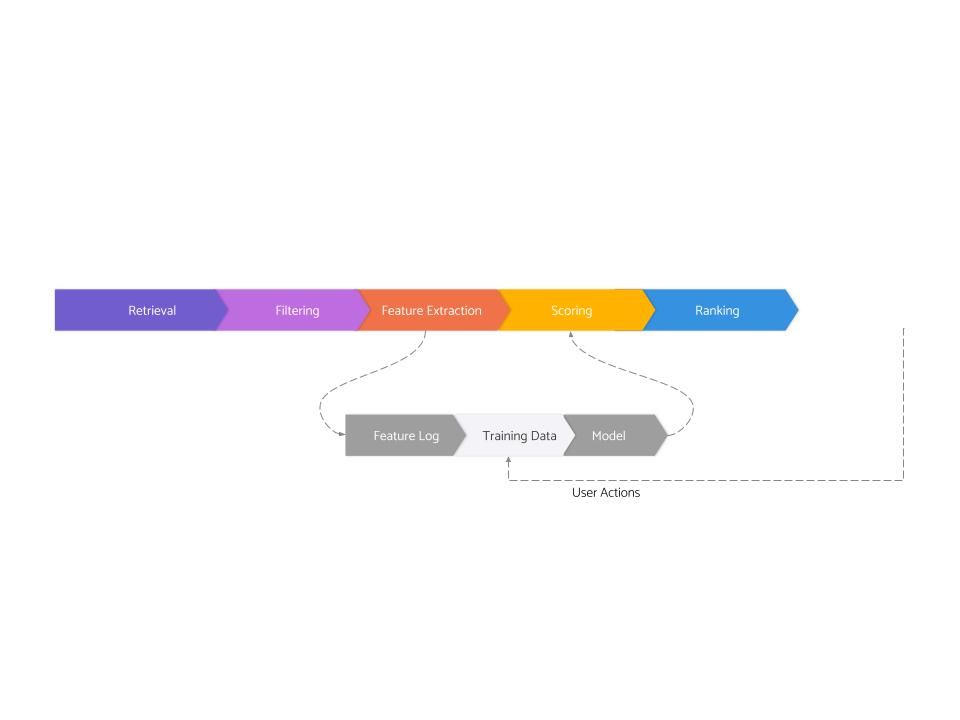
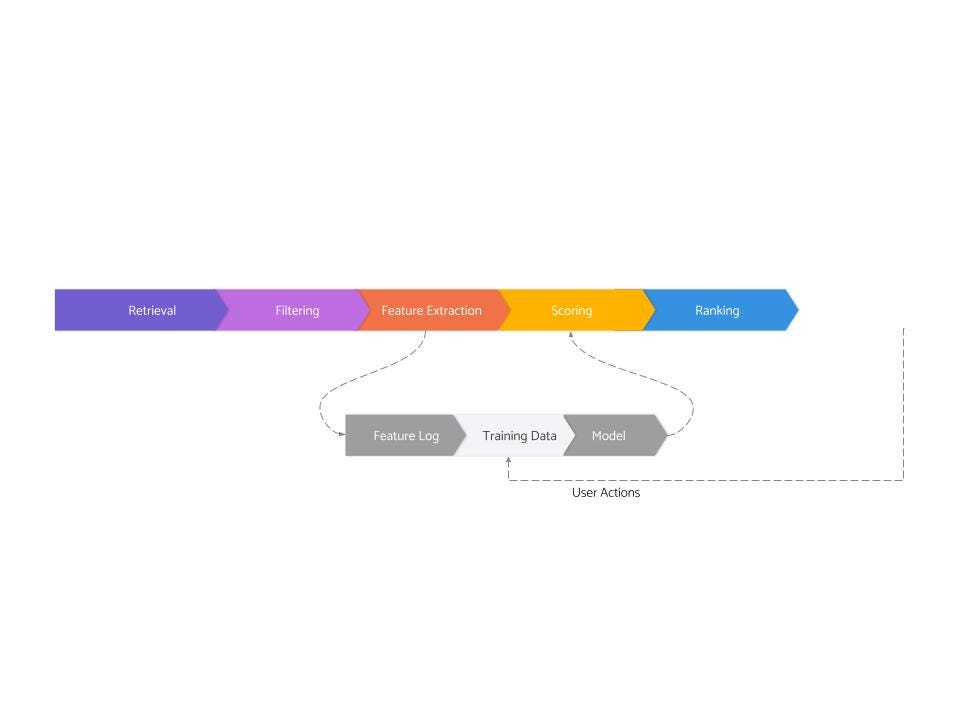
This is the third and the last post in a series about the architecture of real-world recommendation systems developed at FAANG and other top tech companies. The first post covered the serving side, and the second post covered feature logging and training data generation. And this post will cover the very last stage — modeling.

8. Modeling
Modeling is the stage that takes a training dataset and spits out a model which can be used during the scoring stage on the serving side.
Modeling is what most people imagine when they are talking about machine learning (though, as you can see, this is just one of the eight stages and overall, a small part of the large system). This is the stage that involves loading and manipulating data in Jupyter notebooks using tools like pandas/sklearn/pytorch etc. This is the stage that requires deep statistical understanding, and this is also the stage where most of the innovations in neural networks apply more directly.
There is enough detail in this stage that it’s better to further decompose it in three substages:
- Problem formulation
- Data preparation
- Algorithms
Let’s go through these substages one by one.
8.1 Problem Formulation
As discussed earlier, one of the biggest challenges with personalization is that no one knows what the correct label should be. And asking users doesn’t work, at least not well enough to be the primary solution. So effectively, everyone has to resort back to using user actions as the labels.
One of the most important decisions for a modeling engineer is to decide which actions they want to use as labels — e.g., should the goal be to predict the probability of the user clicking the product, or should the goal instead be to predict the probability of user adding the product to the cart. Usually, all such actions live on the spectrum of data volume and signal noise. Heavier signals (e.g., buying a product) are often high signal but they are extremely sparse and so training good models using them doesn’t work. Lighter signals on the other hand (e.g., click, or watch a view for 5 seconds) are a lot more abundant, but each signal instance is a lot noisier. And it’s not just a linear spectrum; there are more considerations too. Some examples:
- Some users never perform some actions. For instance, there are many people out there who might never “like” something on a social product — not because they don’t like the content but simply because they don’t want to broadcast the kind of content they like to read. If the ranking problem is predicting the probability of ‘Like’, for a large chunk of users, the scores will always be zero — not because the models are wrong but because those users are truly not going to take the action of “Like”. And the system might incorrectly interpret that as a user not likely to enjoy the content. The system may end up showing literally random garbage to such people.
- The rewards / costs of various actions are different. For instance, if user were to see just a single thing that they found offensive which they downvote or report, that may completely kill their experience even if they had enjoyed a couple of stories in the same session.
As a result of this, a common technique is to not build one model that predicts one particular action but instead to build multiple models, one for each action that you care about (e.g., “click”, “add to cart”, “buy”, “report”) and combine their scores using some formulae, like:score = p(click) + 2*p(add to cart) + 10*p(buy) - 50*p(report)
This technique is called “value modeling” because the expression describes the expected value experienced by the user as a function of all their potential actions. This also has a nice “diversifying” effect and makes the score more nuanced (vs say, only showing clickbaity content if we only had “click” in the score).
In addition to choosing the actions to predict, some people also change what is called the loss function itself — for instance, instead of predicting probabilities of the user doing an action, they predict the probability of the user liking one thing more than the other. Learning to rank is a particular formulation that also works well in many cases.
Unless you really know what you are doing, it’s probably better to stick with a prediction of binary user actions with the “standard” loss.
8.2 Data Cleaning
Once one or more actions have been identified as the “target” for the model to learn to predict, the corresponding data set is cleaned. The most important aspect of cleaning in such systems is to apply various kinds of data sampling to combat class imbalance and other related problems — if that’s a mouthful, don’t worry; let’s look at a simple example:
Imagine one of the models is trying to predict the probability of users favoriting a product. It is such a rare action that maybe out of 100 impressions, only 1 impression will result in a ‘favorite’ action. For such a dataset, if the model simply learned to say “not favorite” for every content, it will still be right 99% of the time, which is pretty darn good. But that defeats the purpose of training this model because what matters more to us is being able to identify that one product for which users might favorite it.
To solve this problem, examples that are “negative” (i.e., the user did not favorite the content) are randomly removed from the dataset until the ratio of “negative” and “positive” examples is more evenly matched. The model is trained on this sampled dataset which forces it to not be lazy and learn what makes content special enough to be favorited. This is a curious (but not uncommon) case where training on less data actually leads to a better model.
This was just one example, but in practice, many other kinds of sampling is done to make the datasets more well-behaved.
8.3 Algorithms
Once the problem has been formulated as a well-defined ML problem and the dataset has been cleaned, the last step is to run some algorithm on it to actually spit out a model. As mentioned before, unless you know what you’re doing, you should stick with one of logistic regression, GBDTs (e.g., xgboost), or couple of standard neural network architectures. Within neural networks, wide and deep architecture (from this famous youtube paper) and two tower sparse networks, along with variations like multi-task heads, are some of the most common architectures across all of the top tech companies. More recently, sequence learning (inspired by advances in NLP) and graph learning are beginning to get adopted by many teams.
If we zoom in on the feature side once again, in the last few years, the importance of sparse features (e.g., list of IDs or list of categories) has grown quite a lot because neural networks are able to make sense of them (and in some cases, just memorize them). As a result, if there is enough data, modern neural networks can learn from relatively raw data itself. In contrast, other algorithms, say xgboost, can not make sense of sparse features like a list of IDs. More generally, there are crucial relationships between features and the algorithm chosen to learn from those features — many kinds of features work well only for some kind of algorithms.
Whatever algorithm you end up choosing, its hyper parameters still need to be optimized so that learning works well. Practitioners with lots of experience develop good intuition over time about what algorithms and what hyper parameters might work well for a given problem and how to monitor train/test curves to discover problems with learning — all of it makes for an exciting topic but is nuanced enough to deserve a dedicated post.
Depending on the volume of data that is available for training and the number of parameters that need to be learned, there can be HUGE infrastructural challenges in keeping the training process fast, reliable, and cost-efficient. These challenges span all across algorithms, distributed systems, and even hardware. We may talk about that someday in a future post. However, if you’re just getting started with ML, its unlikely that you’re going to run into any of these issues.
But that’s the gist of modeling — formulate the problem as a well-defined ML problem, clean the data, use the right algorithm and hyper parameters, and out comes a model.
Conclusion
That’s it — this finishes our tour of all the stages of production-grade recommendation systems at FAANG and other top tech companies. Despite all the complexity covered here — we have barely scratched the surface. This field is so deep that literally thousands of very smart engineers / researchers have been working on these problems for years in each of the big tech companies. And despite tens of thousands of man-year investment, the ROI of working on these is still off the charts — so much so that an extremely large part of all top-level gains in these companies still come from ranking / recommendation improvements.
It’s definitely true that most non-FAANG companies don’t need to operate anywhere near this level of sophistication for their products. That said, many are simply leaving lot of money on the table by not investing enough in ranking/recommendations. Our hope is that these posts (and many more to be written in the future) will level the playing field a bit and make it easier for everyone to utilize this wonderful technology to realize their business goals.

